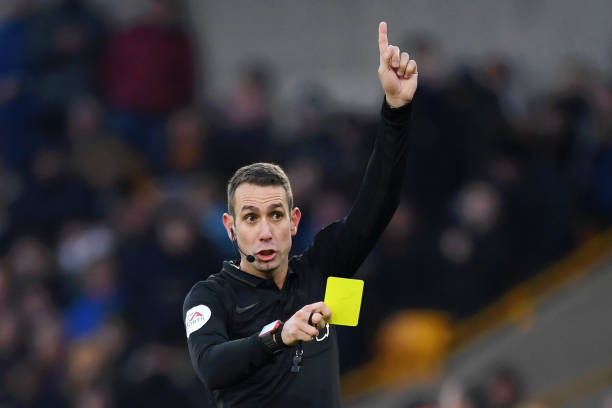
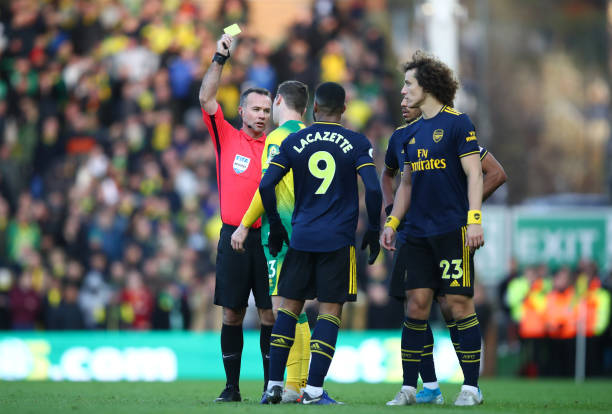
It’s been a few weeks since I updated the yellow card table so let’s see if Arsenal are still picking up more yellows per game than any other side as has been the case all season.

The last time I updated the table was week 11. Then Unai Emery bored the life out of me and it all seemed too depressing.
Now, we’re in week 14 and it’s all change at the club but, alas, on the pitch with the refs, it’s still the same.
Arsenal still pick up more yellows per game than any other side and they still get booked for fewer fouls than others, but the gap is closing.
Manchester United are now in second place, picking up 2.3 yellows per game to Arsenal’s 2.6. They need 4.78 fouls to get booked, Arsenal only 4.14.
At the bottom, where they have been all season, are the Premier League’s top two sides, Liverpool and Leicester.
Quite astonishingly, Leicester need, on average, 11.75 fouls before they see a card and pick up less than one booking per game.
| games | fouls | yellow | FPY | YPG | |
| Arsenal | 14 | 149 | 36 | 4.14 | 2.6 |
| Man United | 14 | 153 | 32 | 4.78 | 2.3 |
| Tottenham | 14 | 144 | 30 | 4.80 | 2.1 |
| Watford | 14 | 153 | 30 | 5.10 | 2.1 |
| Bournemouth | 14 | 125 | 30 | 4.17 | 2.1 |
| Man City | 14 | 128 | 29 | 4.41 | 2.1 |
| Wolves | 14 | 169 | 29 | 5.83 | 2.1 |
| West Ham | 14 | 152 | 29 | 5.24 | 2.1 |
| Everton | 14 | 163 | 28 | 5.82 | 2.0 |
| Sheffield United | 14 | 158 | 28 | 5.64 | 2.0 |
| Burnley | 14 | 149 | 26 | 5.73 | 1.9 |
| Norwich | 14 | 137 | 25 | 5.48 | 1.8 |
| Crystal Palace | 14 | 166 | 24 | 6.92 | 1.7 |
| Chelsea | 14 | 116 | 24 | 4.83 | 1.7 |
| Aston Villa | 14 | 152 | 23 | 6.61 | 1.6 |
| Newcastle | 14 | 120 | 22 | 5.45 | 1.6 |
| Brighton | 14 | 155 | 22 | 7.05 | 1.6 |
| Southampton | 14 | 155 | 19 | 8.16 | 1.4 |
| Liverpool | 14 | 122 | 14 | 8.71 | 1.0 |
| Leicester | 14 | 141 | 12 | 11.75 | 0.9 |
| DailyCannon.com |
FPY = fouls per yellow
|
YPG – yellows per game
|

