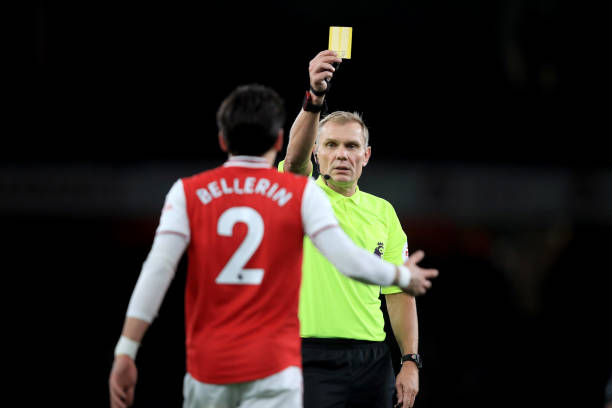
After slipping to second place for a week, Arsenal are back on top of the yellow card table but Liverpool and Leicester are the darlings.

That’s right, your eyes do not deceive you and you are not being paranoid.
Arsenal receive more yellow cards than any other side in the Premier League and need fewer fouls than any other side to pick one up. They also get more yellows per game than any other side.
As an aside, I’ve been concentrating on just yellows this season, only one side (Watford, 4) have had more reds than Arsenal’s three that sees them sit well clear on top of the of the FA’s Fair Play table.
I look at why that might be here.
Here’s the updated table:
Yellow card table
| games | fouls | yellow | FPY | YPG | |
| Arsenal | 24 | 258 | 59 | 4.373 | 2.46 |
| Tottenham | 24 | 241 | 54 | 4.463 | 2.25 |
| Bournemouth | 24 | 222 | 49 | 4.531 | 2.04 |
| Norwich | 24 | 232 | 47 | 4.936 | 1.96 |
| Watford | 24 | 286 | 56 | 5.107 | 2.33 |
| Man City | 24 | 245 | 46 | 5.326 | 1.92 |
| Chelsea | 24 | 239 | 43 | 5.558 | 1.79 |
| Sheffield United | 24 | 263 | 47 | 5.596 | 1.96 |
| West Ham | 23 | 252 | 45 | 5.600 | 1.96 |
| Newcastle | 24 | 220 | 37 | 5.946 | 1.54 |
| Aston Villa | 24 | 271 | 45 | 6.022 | 1.88 |
| Man United | 24 | 267 | 44 | 6.068 | 1.83 |
| Everton | 24 | 288 | 46 | 6.261 | 1.92 |
| Burnley | 24 | 270 | 43 | 6.279 | 1.79 |
| Wolves | 24 | 259 | 40 | 6.475 | 1.67 |
| Brighton | 24 | 249 | 37 | 6.730 | 1.54 |
| Crystal Palace | 24 | 260 | 37 | 7.027 | 1.54 |
| Southampton | 24 | 294 | 38 | 7.737 | 1.58 |
| Liverpool | 23 | 194 | 24 | 8.083 | 1.04 |
| Leicester | 24 | 237 | 23 | 10.304 | 0.96 |
| DailyCannon.com |
FPY = fouls per yellow |
YPG – yellows per game |

