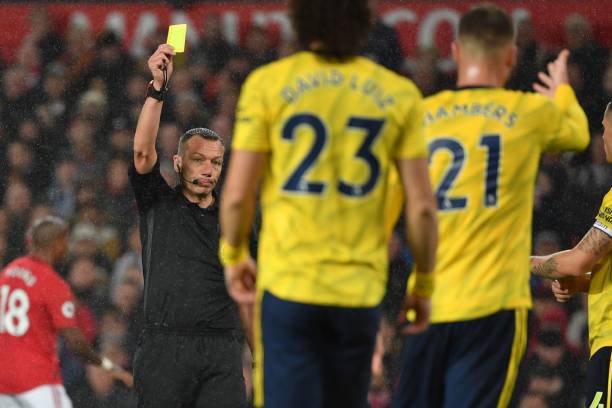
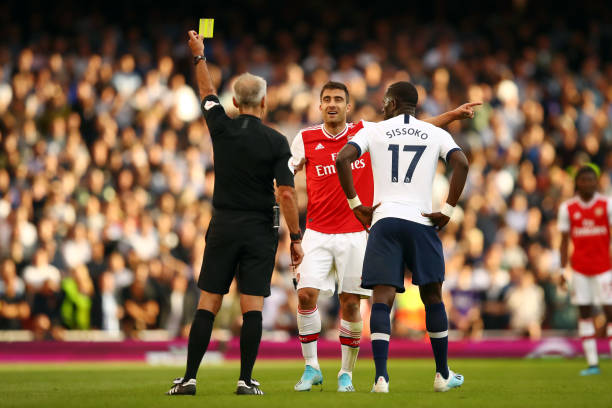
Arsenal sit top of the yellow card table with more yellows than anyone else, a higher yellow-per-game rate than any other side while picking up yellows for fewer fouls than any other side in the Premier League.

Yellow cards, as we know, matter.
They can’t be appealed, they accumulate leading to bans and are, therefore, more important than we often give them credit for being.
Arsenal are still the only side to have been shown more than 20 yellows this season with three sides (Brighton, Liverpool and Leicester) all receiving fewer than 10.
What I really noticed this week was how Leicester picked up four yellows for 17 fouls against Liverpool despite only having five yellows all season for 74 fouls before that game.
Madness.
A few other things that jumped out at me:
- Arsenal only have three fouls more than Burnley but 10 cards more (I understand that type of foul rather than number should dictate number of yellows but are you really telling me Arsenal are more kicky than Burnley?)
- Liverpool are the only side to average less than one yellow card per game.
- Before Arsenal’s game against Bournemouth they averaged three yellows per game.
- Arsenal now average 2.8 yellows after avoiding any cards against the Cherries. The next highest is Everton, a notoriously kicky team, who average 2.4.
Anyway, here is the updated table after this week’s rounds of matches and, as you can see, Arsenal are still top and Liverpool still near the bottom.
| Games | Fouls | Yellows | FPY | YPG | |
| Arsenal | 8 | 80 | 22 | 3.64 | 2.8 |
| Bournemouth | 8 | 68 | 16 | 4.25 | 2.0 |
| Man United | 8 | 89 | 19 | 4.68 | 2.4 |
| Man City | 8 | 81 | 17 | 4.76 | 2.1 |
| Everton | 8 | 94 | 19 | 4.95 | 2.4 |
| Newcastle | 8 | 70 | 14 | 5.00 | 1.8 |
| West Ham | 8 | 82 | 16 | 5.13 | 2.0 |
| Crystal Palace | 8 | 99 | 19 | 5.21 | 2.4 |
| Tottenham | 8 | 90 | 17 | 5.29 | 2.1 |
| Chelsea | 8 | 69 | 13 | 5.31 | 1.6 |
| Wolves | 8 | 88 | 14 | 6.29 | 1.8 |
| Watford | 8 | 85 | 13 | 6.54 | 1.6 |
| Aston Villa | 8 | 100 | 15 | 6.67 | 1.9 |
| Sheffield United | 8 | 90 | 13 | 6.92 | 1.6 |
| Burnley | 8 | 77 | 11 | 7.00 | 1.4 |
| Norwich | 8 | 79 | 11 | 7.18 | 1.4 |
| Southampton | 8 | 95 | 13 | 7.31 | 1.6 |
| Brighton | 8 | 82 | 9 | 9.11 | 1.1 |
| Liverpool | 8 | 70 | 7 | 10.00 | 0.9 |
| Leicester | 8 | 91 | 9 | 10.11 | 1.1 |
*FPY= fouls per yellow
YPG= yellow per game

