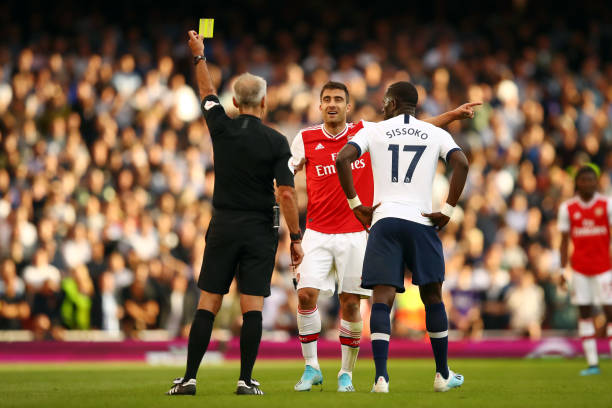
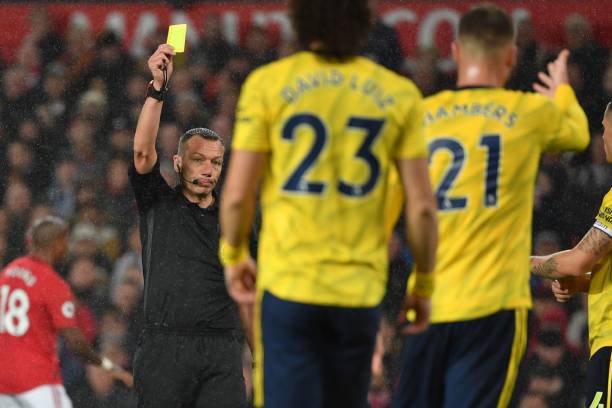
As I was browsing some stats this morning I couldn’t help notice Arsenal’s yellow card count in the league this season and wondered how it stacked up against other teams. It’s safe to say I was astounded by what I found.

When you watch your own team you feel like they are always hard done by.
While we watched Manchester United players get away with fouls Arsenal players had already been booked for, we shook our heads and mumbled. That’s how it is when you go to Old Trafford.
But this season, for Arsenal at least, it seems it’s that way no matter where they are.
Now, I know that the number of fouls isn’t really an indicator of the type of fouls but you would expect that if a side is committing far more fouls they will, at the very least, pick up cards for persistent fouling.
What I found is that not only have Arsenal picked up more yellows than any other side – they are the only team to have over 20 – they get yellows for far fewer fouls.
While it takes only 3.2 fouls to get a yellow if you are in an Arsenal shirt it takes 10.2 if you’re in a Liverpool one and an unbelievable 14.8 if you’re in a Leicester jersey.
Here’s the full table:
| fouls | yellow | FPY | |
| Arsenal | 68 | 21 | 3.2 |
| Bournemouth | 62 | 14 | 4.4 |
| Chelsea | 61 | 13 | 4.7 |
| Man United | 79 | 16 | 4.9 |
| Everton | 82 | 16 | 5.1 |
| Spurs | 83 | 16 | 5.2 |
| Newcastle | 58 | 11 | 5.3 |
| Wolves | 74 | 14 | 5.3 |
| Palace | 92 | 17 | 5.4 |
| West Ham | 71 | 13 | 5.5 |
| Man City | 70 | 12 | 5.8 |
| Watford | 78 | 13 | 6.0 |
| Norwich | 65 | 10 | 6.5 |
| Southampton | 80 | 12 | 6.7 |
| Villa | 83 | 12 | 6.9 |
| Sheff Utd | 84 | 11 | 7.6 |
| Burnley | 72 | 9 | 8.0 |
| B&HA | 71 | 7 | 10.1 |
| Liverpool | 61 | 6 | 10.2 |
| Leicester | 74 | 5 | 14.8 |
Not sure I really need to add anything else to that, do I?

