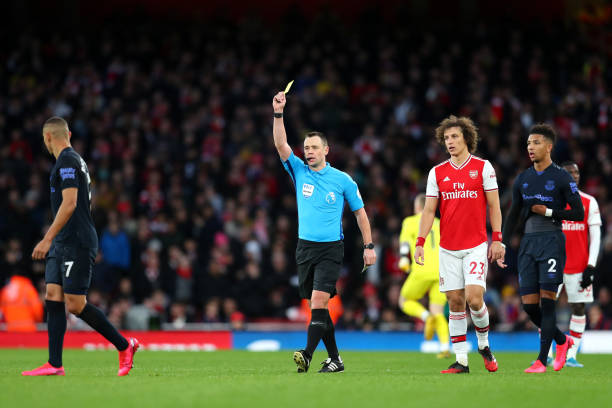
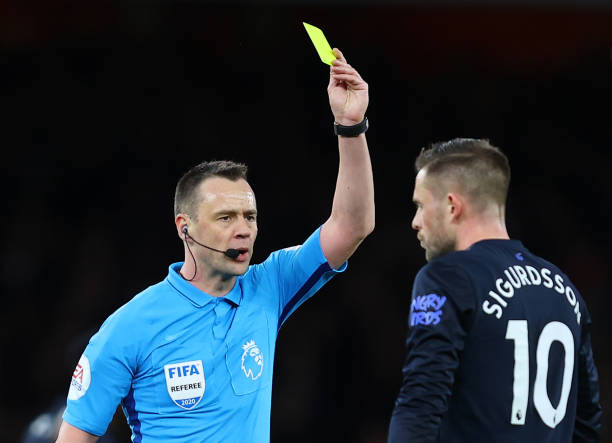
After sitting on top of the table all season, Arsenal have finally dropped down a place as referees move Bournemouth to the top of the yellow card table.

For what I think is the first time this season, Arsenal are no longer top of the yellow card table, nor are they receiving more yellows per foul than other sides.
| games | fouls | yellow | FPY | YPG | |
| Bournemouth | 28 | 257 | 60 | 4.283 | 2.14 |
| Arsenal | 27 | 296 | 64 | 4.625 | 2.37 |
| Tottenham | 28 | 285 | 61 | 4.672 | 2.18 |
| Norwich | 28 | 271 | 53 | 5.113 | 1.89 |
| Newcastle | 28 | 261 | 49 | 5.327 | 1.75 |
| Man City | 27 | 274 | 51 | 5.373 | 1.89 |
| Chelsea | 28 | 283 | 52 | 5.442 | 1.86 |
| Watford | 28 | 334 | 61 | 5.475 | 2.18 |
| West Ham | 28 | 291 | 53 | 5.491 | 1.89 |
| Sheffield United | 27 | 291 | 51 | 5.706 | 1.89 |
| Man United | 28 | 309 | 54 | 5.722 | 1.93 |
| Burnley | 28 | 307 | 53 | 5.792 | 1.89 |
| Aston Villa | 27 | 315 | 54 | 5.833 | 2.00 |
| Everton | 28 | 336 | 57 | 5.895 | 2.04 |
| Brighton | 28 | 281 | 44 | 6.386 | 1.57 |
| Wolves | 28 | 312 | 48 | 6.500 | 1.71 |
| Crystal Palace | 28 | 305 | 44 | 6.932 | 1.57 |
| Southampton | 28 | 341 | 44 | 7.750 | 1.57 |
| Liverpool | 28 | 232 | 26 | 8.923 | 0.93 |
| Leicester | 28 | 293 | 31 | 9.452 | 1.11 |
FPY = fouls per yellow | YPG – yellows per game |
With Martin Atkinson in charge of Arsenal’s game against West Ham on Saturday, this could all change again.
Look out for a post I have coming later about how badly referees are distributed for Arsenal’s game and why that is a really bad thing.
